Upgrade your monitoring setup with Prometheus
After running simple monitoring for quite a while, I decided to upgrade my setup. It is about time to get some real metric gathering to see what’s going on. It’s also time to get some proper monitoring setup.
There are a lot of options in this field and I should, probably, write a blog post on my views on the topic. For this experiment, on the other hand, the solution is already pre-chosen. We’ll be running Prometheus.
Prometheus
To answer the question, what is Prometheus?, we’ll rip a page out of the Prometheus docs.
Prometheus is an open-source systems monitoring and alerting toolkit originally built at SoundCloud. Since its inception in 2012, many companies and organizations have adopted Prometheus, and the project has a very active developer and user community. It is now a standalone open source project and maintained independently of any company. To emphasize this, and to clarify the project’s governance structure, Prometheus joined the Cloud Native Computing Foundation in 2016 as the second hosted project, after Kubernetes.
Prometheus collects and stores its metrics as time series data, i.e. metrics information is stored with the timestamp at which it was recorded, alongside optional key-value pairs called labels.
let’s decypher all this jargon down to plain English. In simple terms, Prometheus is a system that scrape metrics, from your services and applications, and stores those metrics, in a time series database, ready to serve back again when queried.
Prometheus also offers a way to create rules on those metrics to alert you when something goes wrong. Combined with Alertmanager, you got yourself a full monitoring system.
Configuration
Now that we briefly touched on a few features of Prometheus and before we can deploy, we need to write our configuration.
This is an example of a bare configuration.
scrape_configs:
- job_name: prometheus
  scrape_interval: 30s
  static_configs:
  - targets:
    - prometheus:9090
This will make Prometheus scrape itself every 30 seconds for metrics. At least you get some metrics to query later. If you want the full experience, I would suggest you enable Prometheus metrics for your services. Consult the docs of the project to see if and how it can expose metrics for Prometheus to scrape, then add the scrape endpoint to your configuration as shown above.
Here’s a an example of a couple more, well known, projects; Alertmanager and node exporter.
- job_name: alertmanager
  scrape_interval: 30s
  static_configs:
  - targets:
    - alertmanager:9093

- job_name: node-exporter
  scrape_interval: 30s
  static_configs:
  - targets:
    - node-exporter:9100
A wider list of exporters can be found on the Prometheus docs.
Deployment
Now that we got ourselves a cofniguration, let’s deploy Prometheus.
Luckily for us, Prometheus comes containerized and ready to deploy. We’ll be
using docker-compose in this example to make it easier to translate later to
other types of deployments.
Note
I’m still running on 2.x API version. I know I need to upgrade to a newer
version but that’s a bit of networking work. It’s an ongoing work.
The docker-compose file should look like the following.
---
version: '2.3'

services:
  prometheus:
    image: quay.io/prometheus/prometheus:v2.27.0
    container_name: prometheus
    mem_limit: 400m
    mem_reservation: 300m
    restart: unless-stopped
    command:
      - --config.file=/etc/prometheus/prometheus.yml
      - --web.external-url=http://prometheus.localhost/
    volumes:
      - "./prometheus/:/etc/prometheus/:ro"
    ports:
      - "80:9090"
A few things to note, especially for the new container crowd. The container
image version is explicitly specified, do not use latest in production.
To make sure I don’t overload my host, I set memory limits. I don’t mind if it goes down, this is a PoC (Proof of Concept) for the time being. In your case, you might want to choose higher limits to give it more room to breath. When the memory limit is reached, the container will be killed with Out Of Memory error.
In the command section, I specify the external url for Prometheus to redirect me correctly. This is what Prometheus thinks its own hostname is. I also specify the configuration file, previously written, which I mount as read-only in the volumes section.
Finally, we need to port-forward 9090 to our hosts’ 80 if possible to access
Prometheus. Otherwise, figure out a way to route it properly. This is a local
installation, which is suggested by the Prometheus hostname.
If you made it so far, you should be able to run this with no issues.
docker-compose up -d
Prometheus Rules
Prometheus supports two types of rules; recording and alerting. Let’s expand a little bit on those two concepts.
Recording Rules
First, let’s start off with recording rules. I don’t think I can explain it better than the Prometheus documentation which says.
Recording rules allow you to precompute frequently needed or computationally expensive expressions and save their result as a new set of time series. Querying the precomputed result will then often be much faster than executing the original expression every time it is needed. This is especially useful for dashboards, which need to query the same expression repeatedly every time they refresh.
Sounds pretty simple right ? Well it is. Unfortunately, I haven’t needed to create recording rules yet for my setup so I’ll forgo this step.
Alerting Rules
As the name suggests, alerting rules allow you to define conditional expressions based on metrics which will trigger notifications to alert you.
This is a very simple example of an alert rule that monitors all the endpoints scraped by Prometheus to see if any of them is down. If this expression return a result, an alert will fire from Prometheus.
groups:
- name: Instance down
  rules:
  - alert: InstanceDown
    expr: up == 0
    for: 5m
    labels:
      severity: page
    annotations:
      summary: "Instance {{ $labels.instance }} down"
      description: "{{ $labels.instance }} of job {{ $labels.job }} has been down for more than 5 minutes."
To be able to add this alert to Prometheus, we need to save it in a
rules.yml file and then include it in the Prometheus configuration as follows.
rule_files:
- "rules.yml"
Making the configuration intiretly as follows.
rule_files:
- "rules.yml"

scrape_configs:
- job_name: prometheus
  scrape_interval: 30s
  static_configs:
  - targets:
    - prometheus:9090

- job_name: alertmanager
  scrape_interval: 30s
  static_configs:
  - targets:
    - alertmanager:9093

- job_name: node-exporter
  scrape_interval: 30s
  static_configs:
  - targets:
    - node-exporter:9100
At this point, make sure everything is mounted into the container properly and rerun your Prometheus.
Prometheus UI
Congratulations if you’ve made it so far. If you visit http://localhost/ at stage you should get to Prometheus where you can query your metrics.
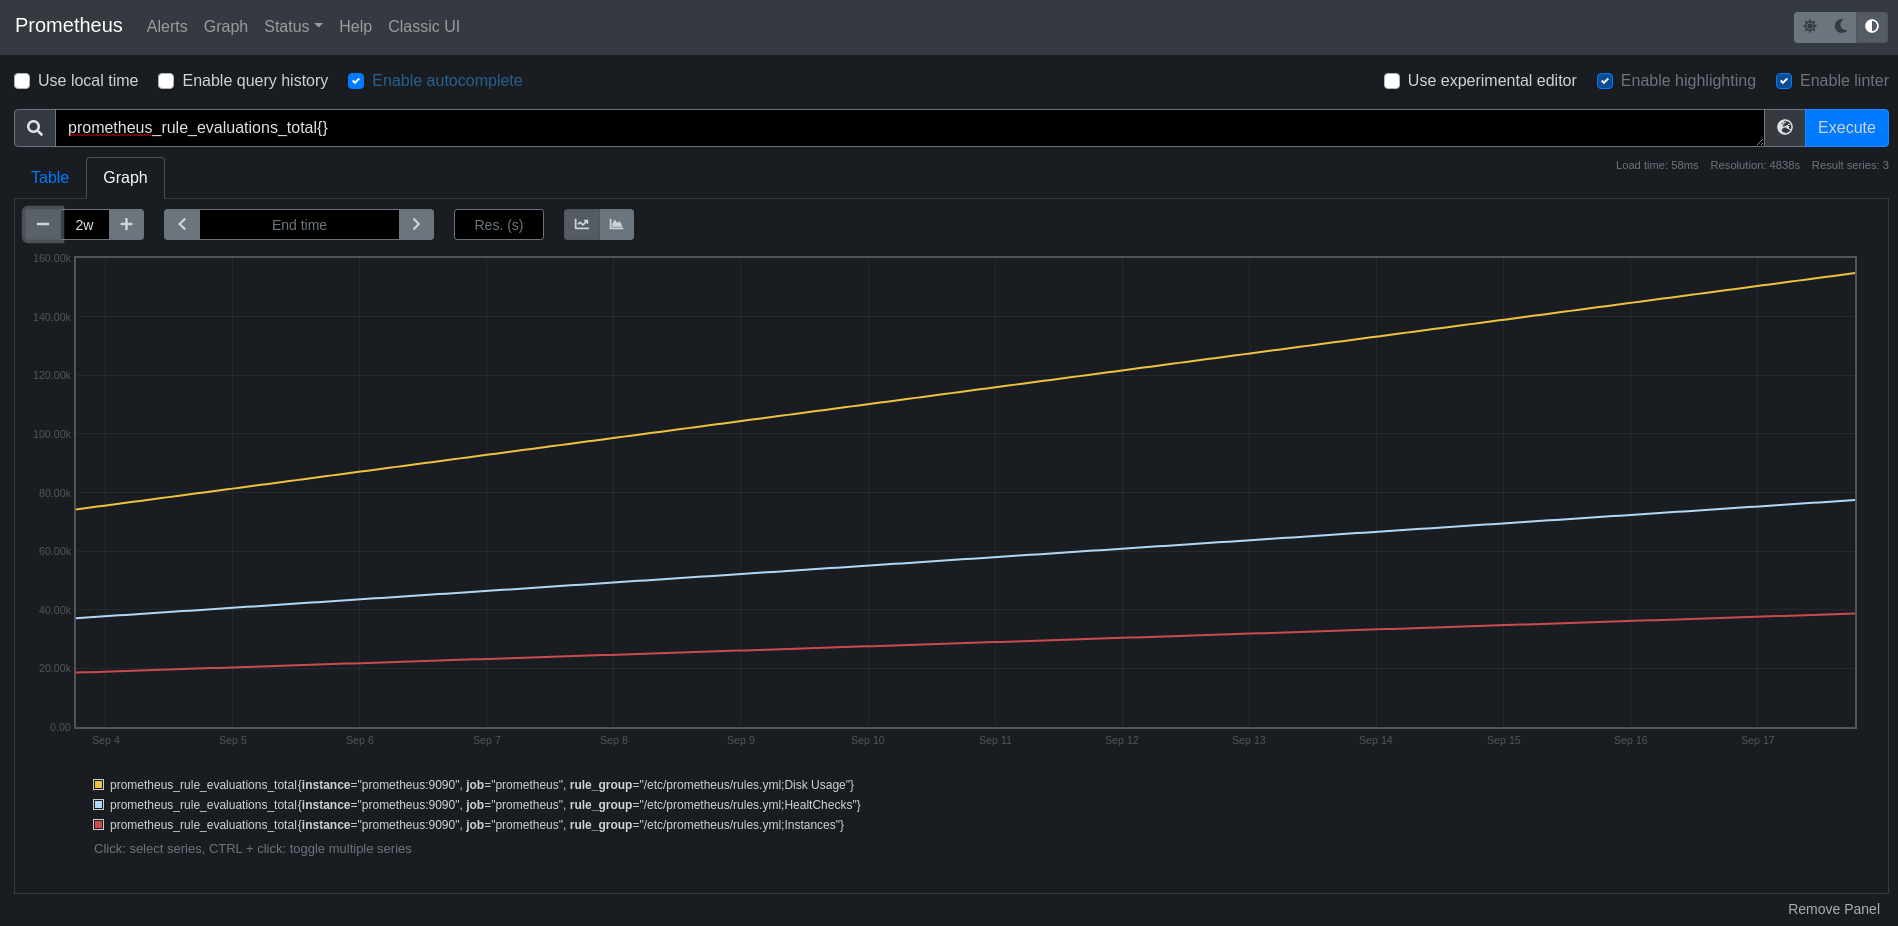
Figure 1: Prometheus overview
You can get all sorts of information under the status drop-down menu.
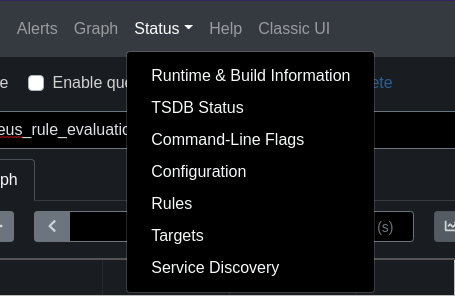
Figure 2: Prometheus Status drop-down menu
Conclusion
As you can see, deploying Prometheus is not too hard. If you’re running Kubernetes, make sure you use the operator. It will make your life a lot easier in all sorts of things.
Take your time to familiarise yourself with Prometheus and consult the documentation as much as possible. It is well written and in most cases your best friend. Figure out different ways to create rules for recording and alerting. Most people at this stage deploy Grafana to start visualizing their metrics. Well… Not in this blog post we ain’t !
I hope you enjoy playing around with Prometheus and until the next post.